


Nationally in Labor Participation
Economic Impact
Want to add $26,000,000 to your local economy? Would you settle for adding $13,000,000?
If you attended the 2003 Dairy University sponsored by the western Kansas Rural Economic Development Alliance (wKREDA), you learned how adding a 2,500-cow dairy to your county could generate $13,000,000 for your local economy. If that interests you, read on...
The wKREDA Dairy Team, made up of volunteers from western Kansas, have been working to promote dairies in western Kansas for many years. During the past year, the Dairy Team has been working with a dairy consulting business, Avenues for Change, owned by Monte Hemenover. Monte has helped the Dairy Team identify the economic benefits of dairy development and is continuing to help the group pursue the best ways to expand this industry in western Kansas.
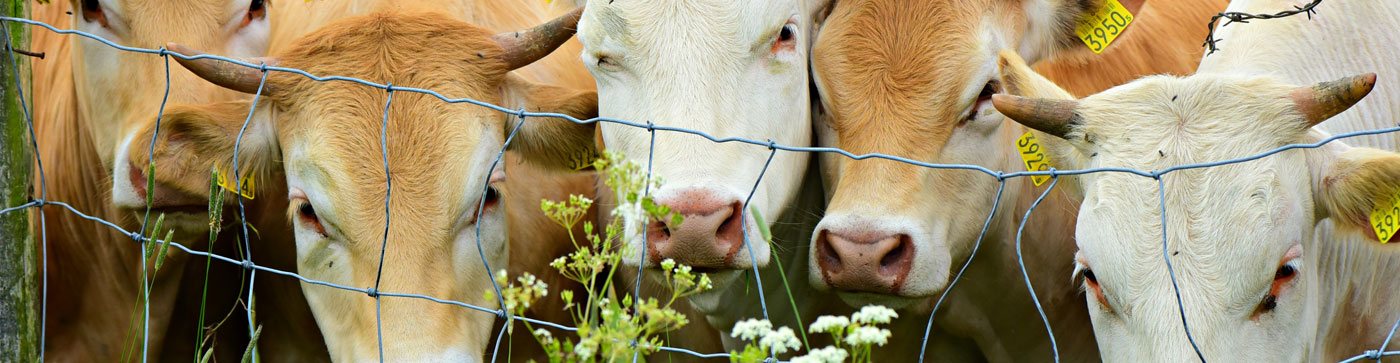
First, it may be helpful to understand construction and operating differences between types of dairies—dry lot and free stall. A dry lot dairy is built much like a traditional beef feedlot. During milking operations, cows go to the central milking parlor, returning to the lot to drink and eat until the next milking time.
Dry lot construction costs are approximately $3,900 per cow and the cows typically deliver an average of 60 pounds of milk per day. Dr. John Smith, Kansas State University Dairy Extension Specialist, believes that dry lot dairies may not be an option for dairy farmers in the northern climates because of weather concerns. Dr. Smith feels the western Kansas climate is an advantage for dry lot dairies.
A free stall dairy houses cows in free stall barns, typically with open sides for air movement throughout. The barns are swept by machine or flushed with water on a regular basis. The construction cost per cow for free stall facilities is approximately $4,700 per cow for facilities and produces an average of 80 pounds of milk per cow per day. The tradeoff of the additional facility investment and greater cow care helps the cow produce more milk.
Kansas dairy results show remarkable statistics:
- From 1997 to 2002 Kansas had the third largest percentage of increased milk production in the country with 56.42%, following New Mexico at 57.47% and Idaho with 57.04%.
- During 2002 Kansas ranked first in increased milk production with a 24.8% increase from 2001. No other state has ever recorded such an increase.
- During 2002 Kansas production ranked 8th in the nation with 19,515 pounds of milk per cow. Production statistics continue to increase and is an indication of the continued efficiencies gained by western Kansas dairies.
- Kansas had over 103,000 diary cows by the end of 2002, up from 88,000 in 1997.
Why Has Kansas Seen Such an Increase in Dairy Production?
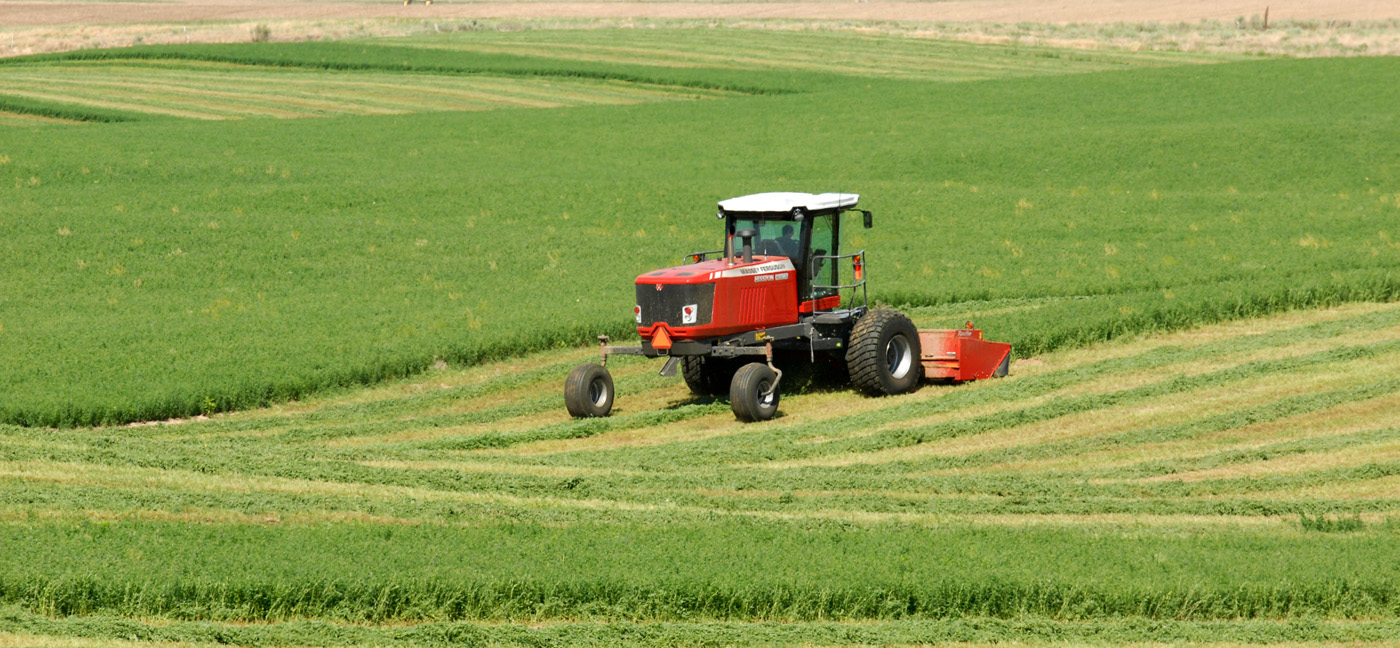
Many of the components needed for the beef industry are also necessary for dairies. Feed, grain, water, space, labor, and a pro-agriculture community are already available in western Kansas. These elements that support beef operations are also vital to the success of dairy operations.
For example, dairy cows annually consume:
- 2.2 tons of corn
- 2.5 tons of alfalfa
- 7.3 tons of silage or haylage
- 1.75 tons of soybean meal and hulls
- 1.25 tons of whole cottonseed
As you can see, much of the feed dairy cows consume is grown in western Kansas. New processing for soybean and cotton within western Kansas may also make the commodity by-products available.
Monte Hemenover has developed a model to measure the direct, indirect, and induced impacts of dairy operations in Kansas. He estimates that each cow generates $3,030 annually from milk sales, calf sales, and cull cow sales. He considers this a direct impact, as the revenues from these sales are deposited in the dairy bank account.
Dairy Cow Impacts on the Local Economy
Direct:
- Annual Revenue (milk, calf, cull revenue) • S3,030.00
Indirect (57% of total direct revenues):
- Revenues from employee wages, services, etc. $1,727.10
- Induced (37.5% of indirect impacts): $3,030.00
- Revenues from employee purchases, service provider expenditures, etc. $647.66
Total Direct, Indirect, and Induced Impacts per Dairy Cow $5,404.76
Indirect impacts are realized as the dairy pays employees, hires services (nutritionist, veterinary, etc.), and purchases replacement heifers. Monte's model assumes that the direct revenue circulates through the industry .57 times; so indirect impacts of the $3,030 per cow revenue results in $1727 additional spending.
Induced impacts are realized as employees purchase household goods, service companies hire additional employees, truck drivers purchase gas at the convenience store, etc. Monte's model calculates induced impacts by multiplying the indirect expenditures by 37.5% to get $647.66 per cow. Multiplying this figure by the number of cows per dairy shows how the revenue alone can be introduced to a local economy.
Number of Head per Dairy/Economic Impact
- 1,000 head/$5,404,760.00
- 1,500 head/$8,107,140.00
- 2,000 head/$10,809,520.00
- 2,500 head/$13,511,900.00
This model results in a turnover of 1.8 from the original direct revenue from the cow. Can you think of an alternative development effort that could create similar impacts in your community?
For More Information Contact the wKREDA Dairy Team or visit us at www.DairyInKansas.com:
- Ralph Goodnight • 620-355-7358 • kecodev@pld.com
- John Kennedy • 620-384-7317 • hmcoecon@gmail.com
- Ed Wiltse • 620-356-4111 • edwiltse@pld.com
- Gabe Schlickau • 316-941-1656 • gabe.schlickau@blackhillscorp.com
- Joann Knight • 800-381-3690 • jknight@dodgedev.org
- Nikki Pfannenstiel • 785-623-3334 • pfannenstiel@sunflower.net