


Nationally in Labor Participation
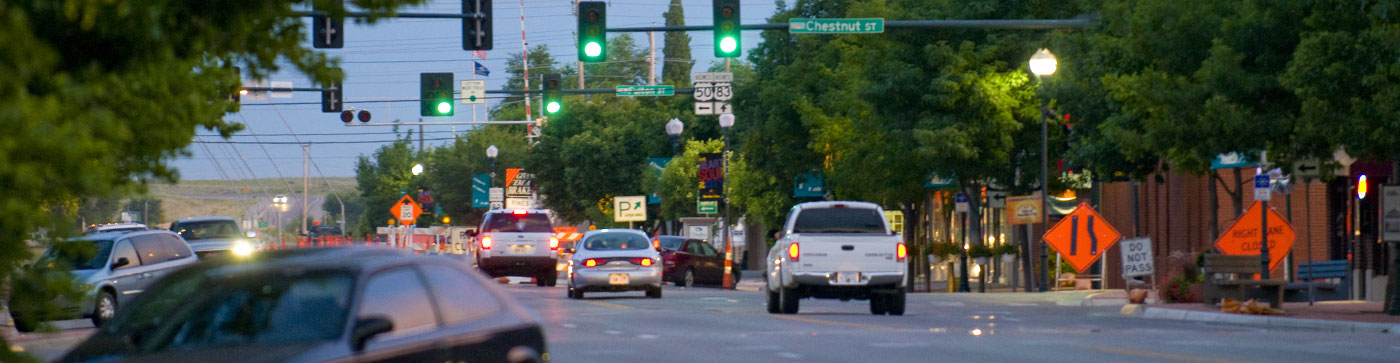
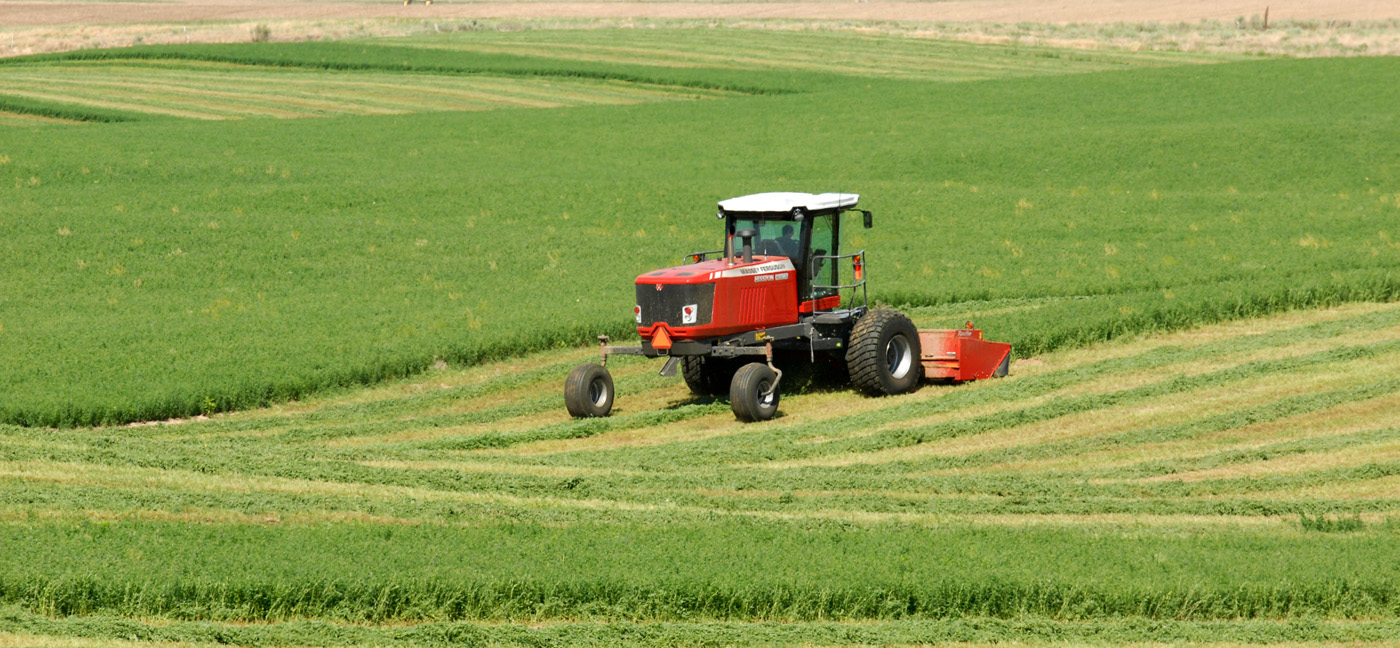
Barber County
Population
Back To Top
Population
| Population | 2000 | 2010 | 2023 | 2028 |
|---|---|---|---|---|
| Barber County | 5,307 | 4,861 | 4,006 | 3,762 |
Source: ESRI, 2023-10-17
Population by Age
| Population | 2010 | 2023 | 2028 |
|---|---|---|---|
| 0-4 | 307 | 215 | 198 |
| 5-9 | 271 | 237 | 211 |
| 10-14 | 295 | 238 | 239 |
| 15-19 | 322 | 198 | 220 |
| 20-24 | 228 | 181 | 142 |
| 25-29 | 270 | 225 | 163 |
| 30-34 | 240 | 223 | 197 |
| 35-39 | 220 | 203 | 204 |
| 40-44 | 240 | 195 | 202 |
| 45-49 | 355 | 201 | 202 |
| 50-54 | 423 | 254 | 205 |
| 55-59 | 381 | 291 | 235 |
| 60-64 | 318 | 335 | 278 |
| 65-69 | 280 | 326 | 319 |
| 70-74 | 207 | 249 | 266 |
| 75-79 | 224 | 189 | 207 |
| 80-84 | 128 | 121 | 140 |
| 85+ | 152 | 125 | 134 |
| 18+ | 3,769 | 3,190 | 2,974 |
| Median Age | 46 | 47 | 48 |
Source: ESRI, 2023-10-17
Population by Race
| Barber County | 2023 |
|---|---|
| Total | 4,006.00 |
| White Alone | 90.79 |
| Black Alone | 0.20 |
| American Indian Alone | 0.85 |
| Asian Alone | 0.40 |
| Pacific Islander Alone | 0.12 |
| Some Other Race | 2.30 |
| Two or More Races | 5.34 |
| Hispanic Origin | 4.07 |
| Diversity Index | 23.70 |
Source: ESRI, 2023-10-17
Growth Rate
| Barber County | 2023 - 2028 |
|---|---|
| Population | -1.25% |
| Households | -0.98% |
| Families | -1.02% |
| Median Household Income | 3% |
| Per Capita Income | 3% |
Source: ESRI, 2023-10-17
Back To TopHousing
Back To Top
Households
| Population | 2000 | 2010 | 2023 | 2028 |
|---|---|---|---|---|
| Households | 2,235 | 2,139 | 1,831 | 1,743 |
| Housing Units | 2,740 | 2,765 | 2,526 | 2,437 |
| Owner Occupied Units | 1,345 | 1,302 | ||
| Renter Occupied Units | 486 | 441 | ||
| Vacant Units | 695 | 694 |
Source: ESRI, 2023-10-17
Home Value
| Barber County | 2023 | 2028 |
|---|---|---|
| Median Home Value | $108,540 | $121,823 |
| Average Home Value | $141,561 | $153,091 |
| <$50,000 | 323 | 290 |
| $50,000 - $99,999 | 315 | 282 |
| $100,000 - $149,999 | 202 | 181 |
| $150,000 - $199,999 | 213 | 220 |
| $200,000 - $249,999 | 62 | 64 |
| $250,000 - $299,999 | 125 | 143 |
| $300,000 - $399,999 | 45 | 52 |
| $400,000 - $499,999 | 48 | 55 |
| $500,000 - $749,999 | 0 | 0 |
| $1,000,000 + | 0 | 0 |
Source: ESRI, 2023-10-17
Housing Year Built
| Year Range | Houses Built |
|---|---|
| 2010 or Later | 153 |
| 2000-2009 | 156 |
| 1990-1999 | 94 |
| 1980-1989 | 224 |
| 1970-1979 | 262 |
| 1960-1969 | 248 |
| 1950-1959 | 448 |
| 1940-1949 | 208 |
| 1939 or Before | 716 |
Source: ESRI, 2023-10-17
Back To TopIncome
Back To Top
Income
| Barber County | 2023 | 2028 |
|---|---|---|
| Median Household | $58,444 | $69,317 |
| Average Household | $89,276 | $103,200 |
| Per Capita | $40,820 | $47,831 |
Source: ESRI, 2023-10-17
Household Income Base
| Barber County | 2023 |
|---|---|
| <$15,000 | 194 |
| $15,000 - $24,999 | 191 |
| $25,000 - $34,999 | 90 |
| $35,000 - $49,999 | 318 |
| $50,000 - $74,999 | 289 |
| $75,000 - $99,999 | 207 |
| $100,000 - $149,999 | 300 |
| $150,000 - $199,999 | 123 |
| $200,000+ | 119 |
Source: ESRI, 2023-10-17
Back To TopEmployees
Back To Top
Commute
| Category | Commuters |
|---|---|
| Workers 16+ | 1,988 |
| In-County Residents | 1,442 |
| Out-of-County Residents | 338 |
| Drive Alone | 1,720 |
| Carpooled | 142 |
| Public Transport | 6 |
| Work at Home | 69 |
| Less than 5 minutes | 206 |
| 5-9 minutes | 441 |
| 10-14 minutes | 374 |
| 15-19 minutes | 184 |
| 20-24 minutes | 172 |
| 25-29 minutes | 60 |
| 30-34 minutes | 292 |
| 35-39 minutes | 25 |
| 40-44 minutes | 39 |
| 45-59 minutes | 81 |
| 60-89 minutes | 39 |
| 90+ minutes | 6 |
| Average Travel Time | 17 |
Source: ESRI, 2023-10-17
Source: ESRI, 2023-10-17
Employees by NAICS
| Category | Number |
|---|---|
| Total Employees | 2,309 |
| Agr/Forestry/Fish/Hunt | 50 |
| Mining | 54 |
| Utilities | 0 |
| Construction | 78 |
| Manufacturing | 240 |
| Wholesale Trade | 31 |
| Retail Trade | 250 |
| Motor Veh/Parts Dealers | 63 |
| Furn & Home Furnish Str | 4 |
| Electronics & Appl Store | 3 |
| Bldg Matl/Garden Equip | 10 |
| Food & Beverage Stores | 102 |
| Health/Pers Care Stores | 10 |
| Gasoline Stations | 8 |
| Clothing/Accessory Store | 3 |
| Sports/Hobby/Book/Music | 23 |
| General Merchandise Str | 24 |
| Misc Store Retailers | 0 |
| Nonstore Retailers | 0 |
| Transportation/Warehouse | 37 |
| Information | 120 |
| Finance & Insurance | 59 |
| Cntrl Bank/Crdt Intrmdtn | 30 |
| Sec/Cmdty Cntrct/Oth Inv | 5 |
| Insur/Funds/Trusts/Other | 24 |
| Real Estate/Rent/Leasing | 26 |
| Prof/Scientific/Tech Srv | 82 |
| Legal Services | 14 |
| Mgmt of Comp/Enterprises | 0 |
| Admin/Support/Waste Mgmt | 13 |
| Educational Services | 158 |
| HealthCare/Social Assist | 525 |
| Arts/Entertainment/Rec | 31 |
| Accommodation/Food Srvcs | 128 |
| Accommodation | 14 |
| Food Srv/Drinking Places | 114 |
| Other Srv excl Pub Admin | 185 |
| Auto Repair/Maintenance | 20 |
| Public Administration Emp | 228 |
Source: ESRI, 2023-10-17
Educational Attainment (25+)
| Barber County | 2023 |
|---|---|
| Some High School | 187 |
| Graduated High School | 918 |
| Associates Degree | 318 |
| Bachelor's Degree | 549 |
| Graduate Degree | 219 |
Source: ESRI, 2023-10-17
Back To TopBusinesses
Back To Top
Businesses by NAICS
| Category | Number |
|---|---|
| Total Businesses | 373 |
| Agr/Forestry/Fish/Hunt Bus | 18 |
| Mining Bus | 11 |
| Utilities Bus | 0 |
| Construction Bus | 26 |
| Manufacturing Bus | 13 |
| Wholesale Trade Bus | 8 |
| Retail Trade Bus | 44 |
| Motor Veh/Parts Dealers Bus | 7 |
| Furn & Home Furnish Str Bus | 1 |
| Electronics & Appl Store Bus | 1 |
| Bldg Matl/Garden Equip Bus | 4 |
| Food & Beverage Stores Bus | 13 |
| Health/Pers Care Stores Bus | 2 |
| Gasoline Stations Bus | 2 |
| Clothing/Accessory Store Bus | 1 |
| Sports/Hobby/Book/Music Bus | 9 |
| General Merchandise Str Bus | 4 |
| Misc Store Retailers Bus | 0 |
| Nonstore Retailers Bus | 0 |
| Transportation/Warehouse Bus | 14 |
| Information Bus | 10 |
| Finance & Insurance Bus | 17 |
| Cntrl Bank/Crdt Intrmdtn Bus | 5 |
| Sec/Cmdty Cntrct/Oth Inv Bus | 3 |
| Insur/Funds/Trusts/Other Bus | 9 |
| Real Estate/Rent/Leasing Bus | 8 |
| Prof/Scientific/Tech Srv Bus | 23 |
| Legal Services Bus | 5 |
| Mgmt of Comp/Enterprises Bus | 0 |
| Admin/Support/Waste Mgmt Bus | 4 |
| Educational Services Bus | 9 |
| HealthCare/Social Assist Bus | 22 |
| Arts/Entertainment/Rec Bus | 8 |
| Accommodation/Food Srvcs Bus | 23 |
| Accommodation Bus | 6 |
| Food Srv/Drinking Places Bus | 17 |
| Other Srv excl Pub Admin Bus | 53 |
| Auto Repair/Maintenance Bus | 7 |
| Public Administration Bus | 45 |
Source: ESRI, 2023-10-17
Back To Top